
Infographics make complex information eye-catching, understandable and easily digestible. Most importantly, they play a crucial role in the increasingly visual world of marketing. Having a visually impactful way to display important information that differentiates your firm can make your website stand out from the crowd.
Creating Effective Infographics
What makes infographics so engaging is the clear depiction of data. Content is key when designing infographics. Therefore, your first step should be to identify your key facts, then consider ways to visually display the information. Consider highlighting notable information such as the number of cases, completed projects, core service areas, office locations/geographic reach, rankings and awards, referral or repeat-client rates, length of client relationships, firm diversity, and any other unique differentiators!
Effective Infographics Typically Have 3 Key Qualities
- Interesting Content: Content should be interesting and unique to your firm.
- Short & Sweet: Make sure it’s not too lengthy, 5-7 words max. Otherwise, you’ll lose your visitors’ attention.
- Clear Hierarchy: Highlight key info with larger, bolder fonts. Description font size should be smaller and less bold.
Types of Infographics
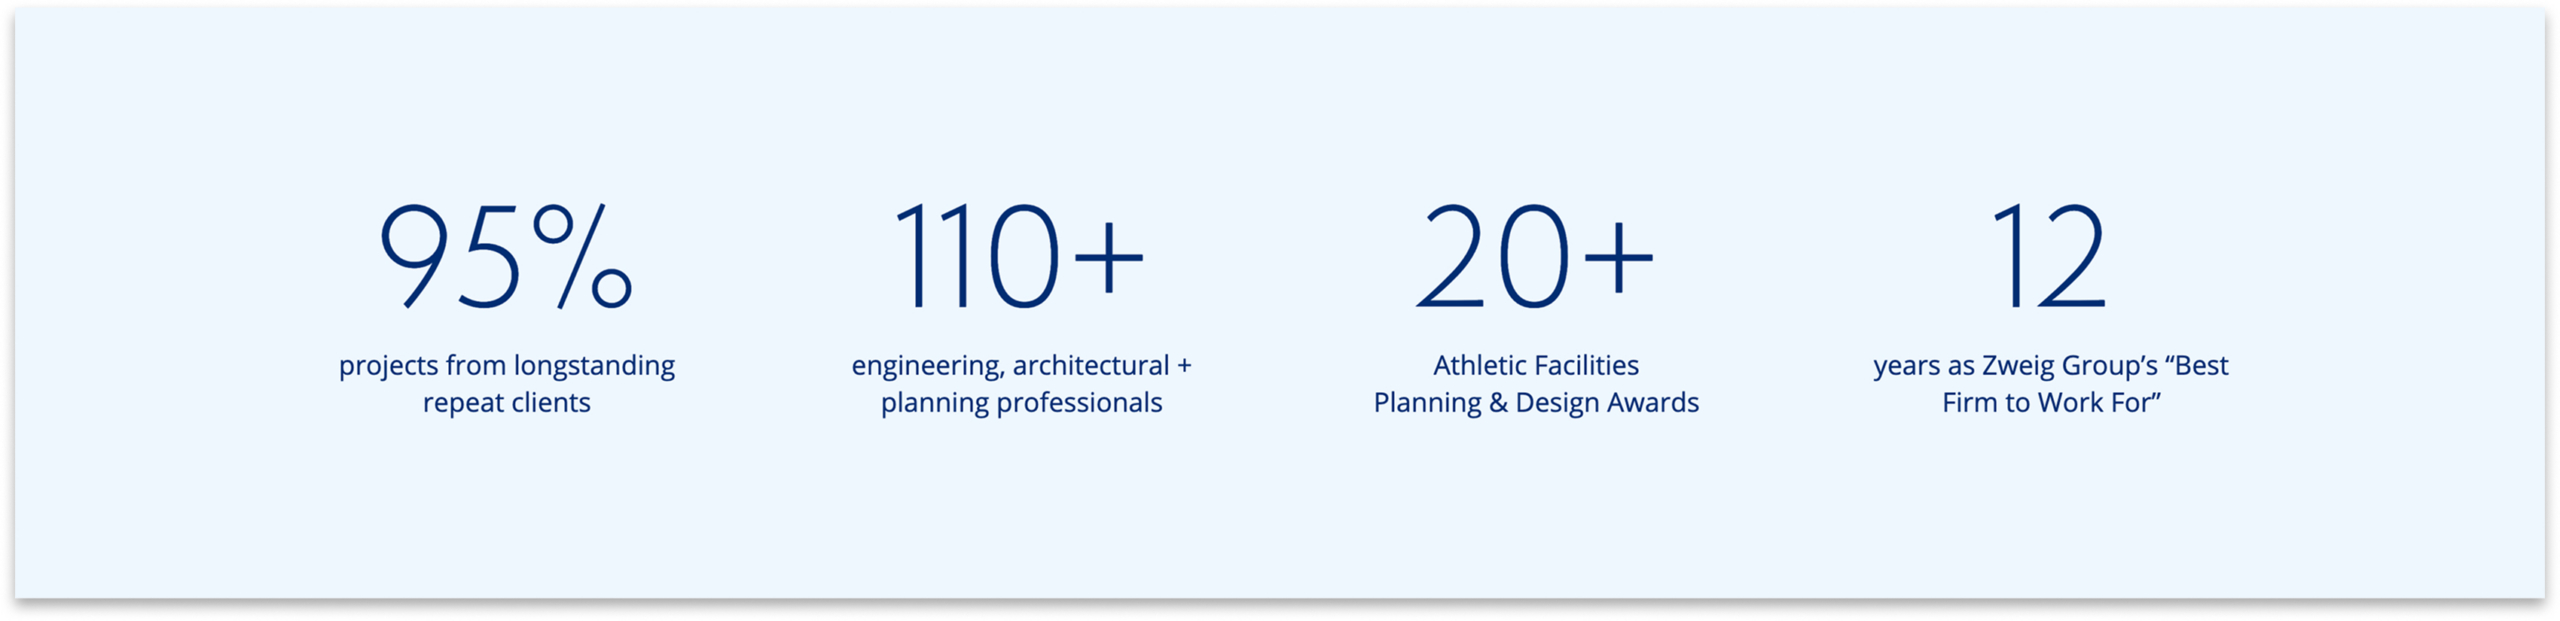
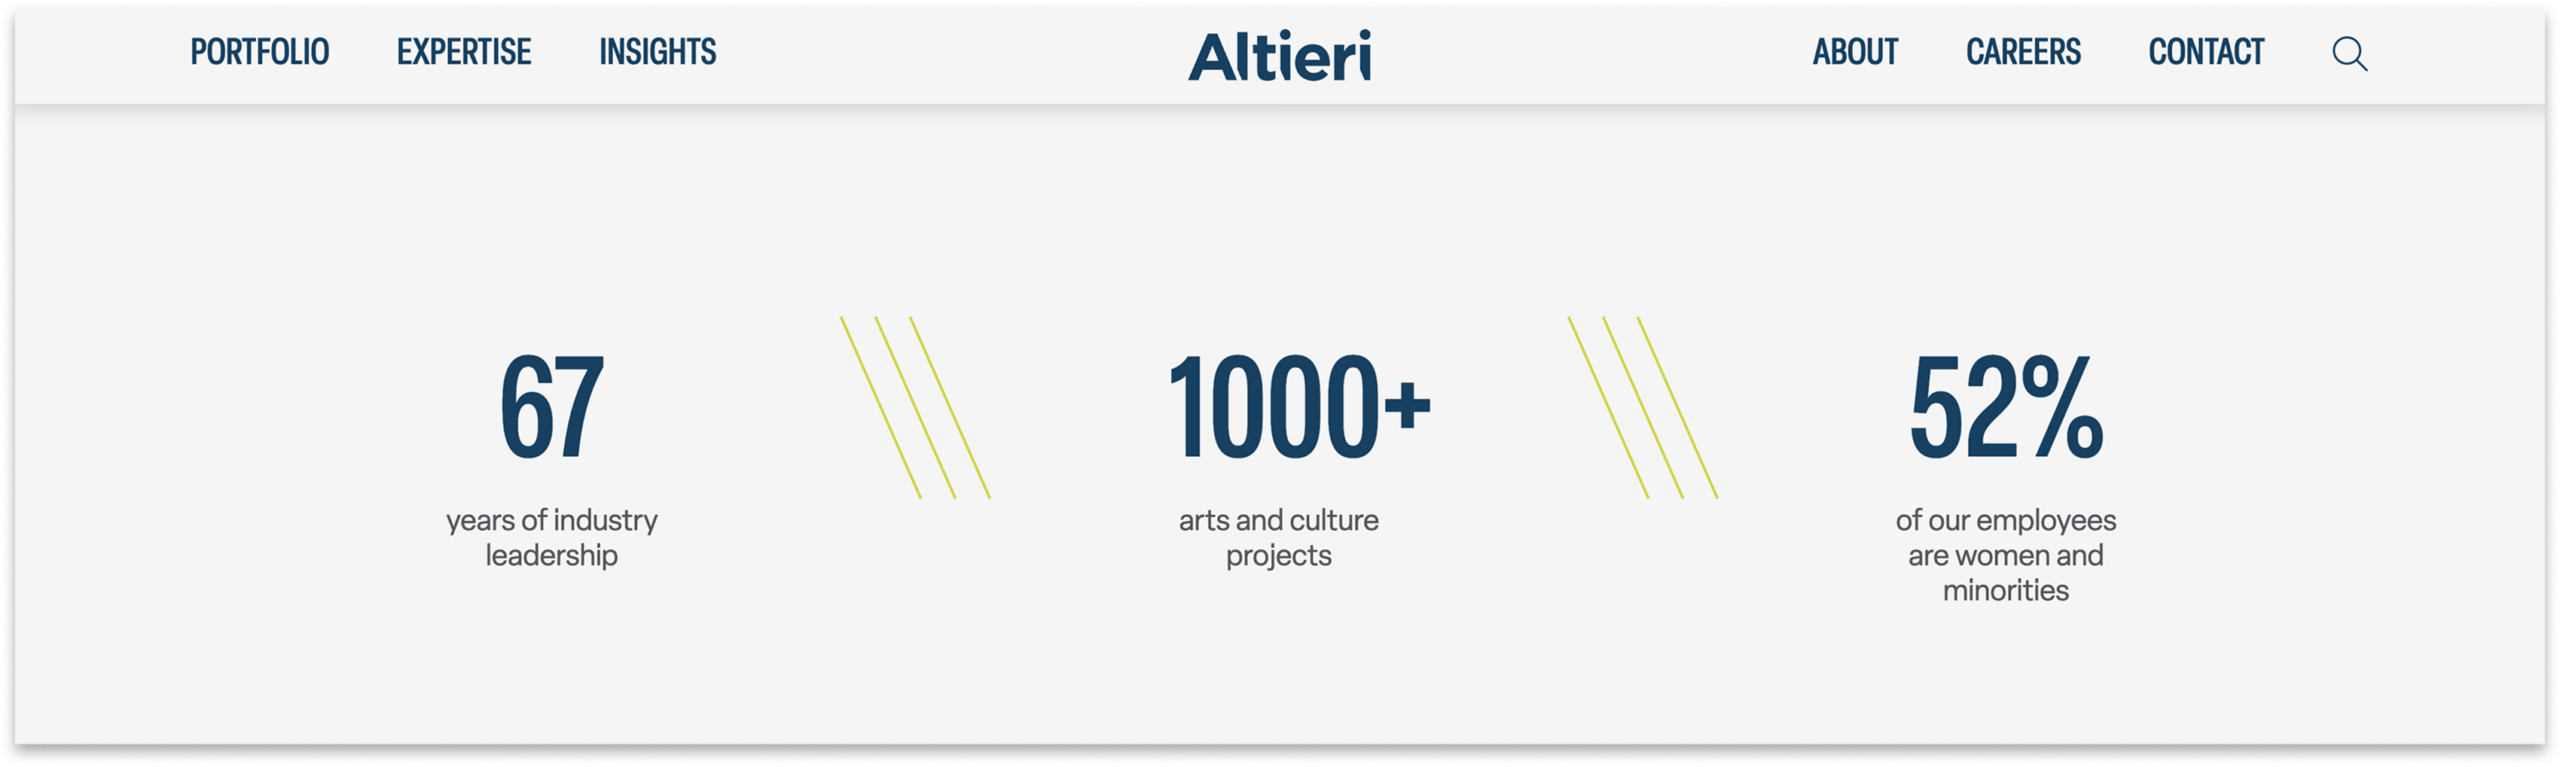
Static Infographics
Static infographics don’t require hovering to reveal information, but can still have subtle animations such as counting up or fading in. Static designs offer a quick, impactful way to communicate information at a glance.

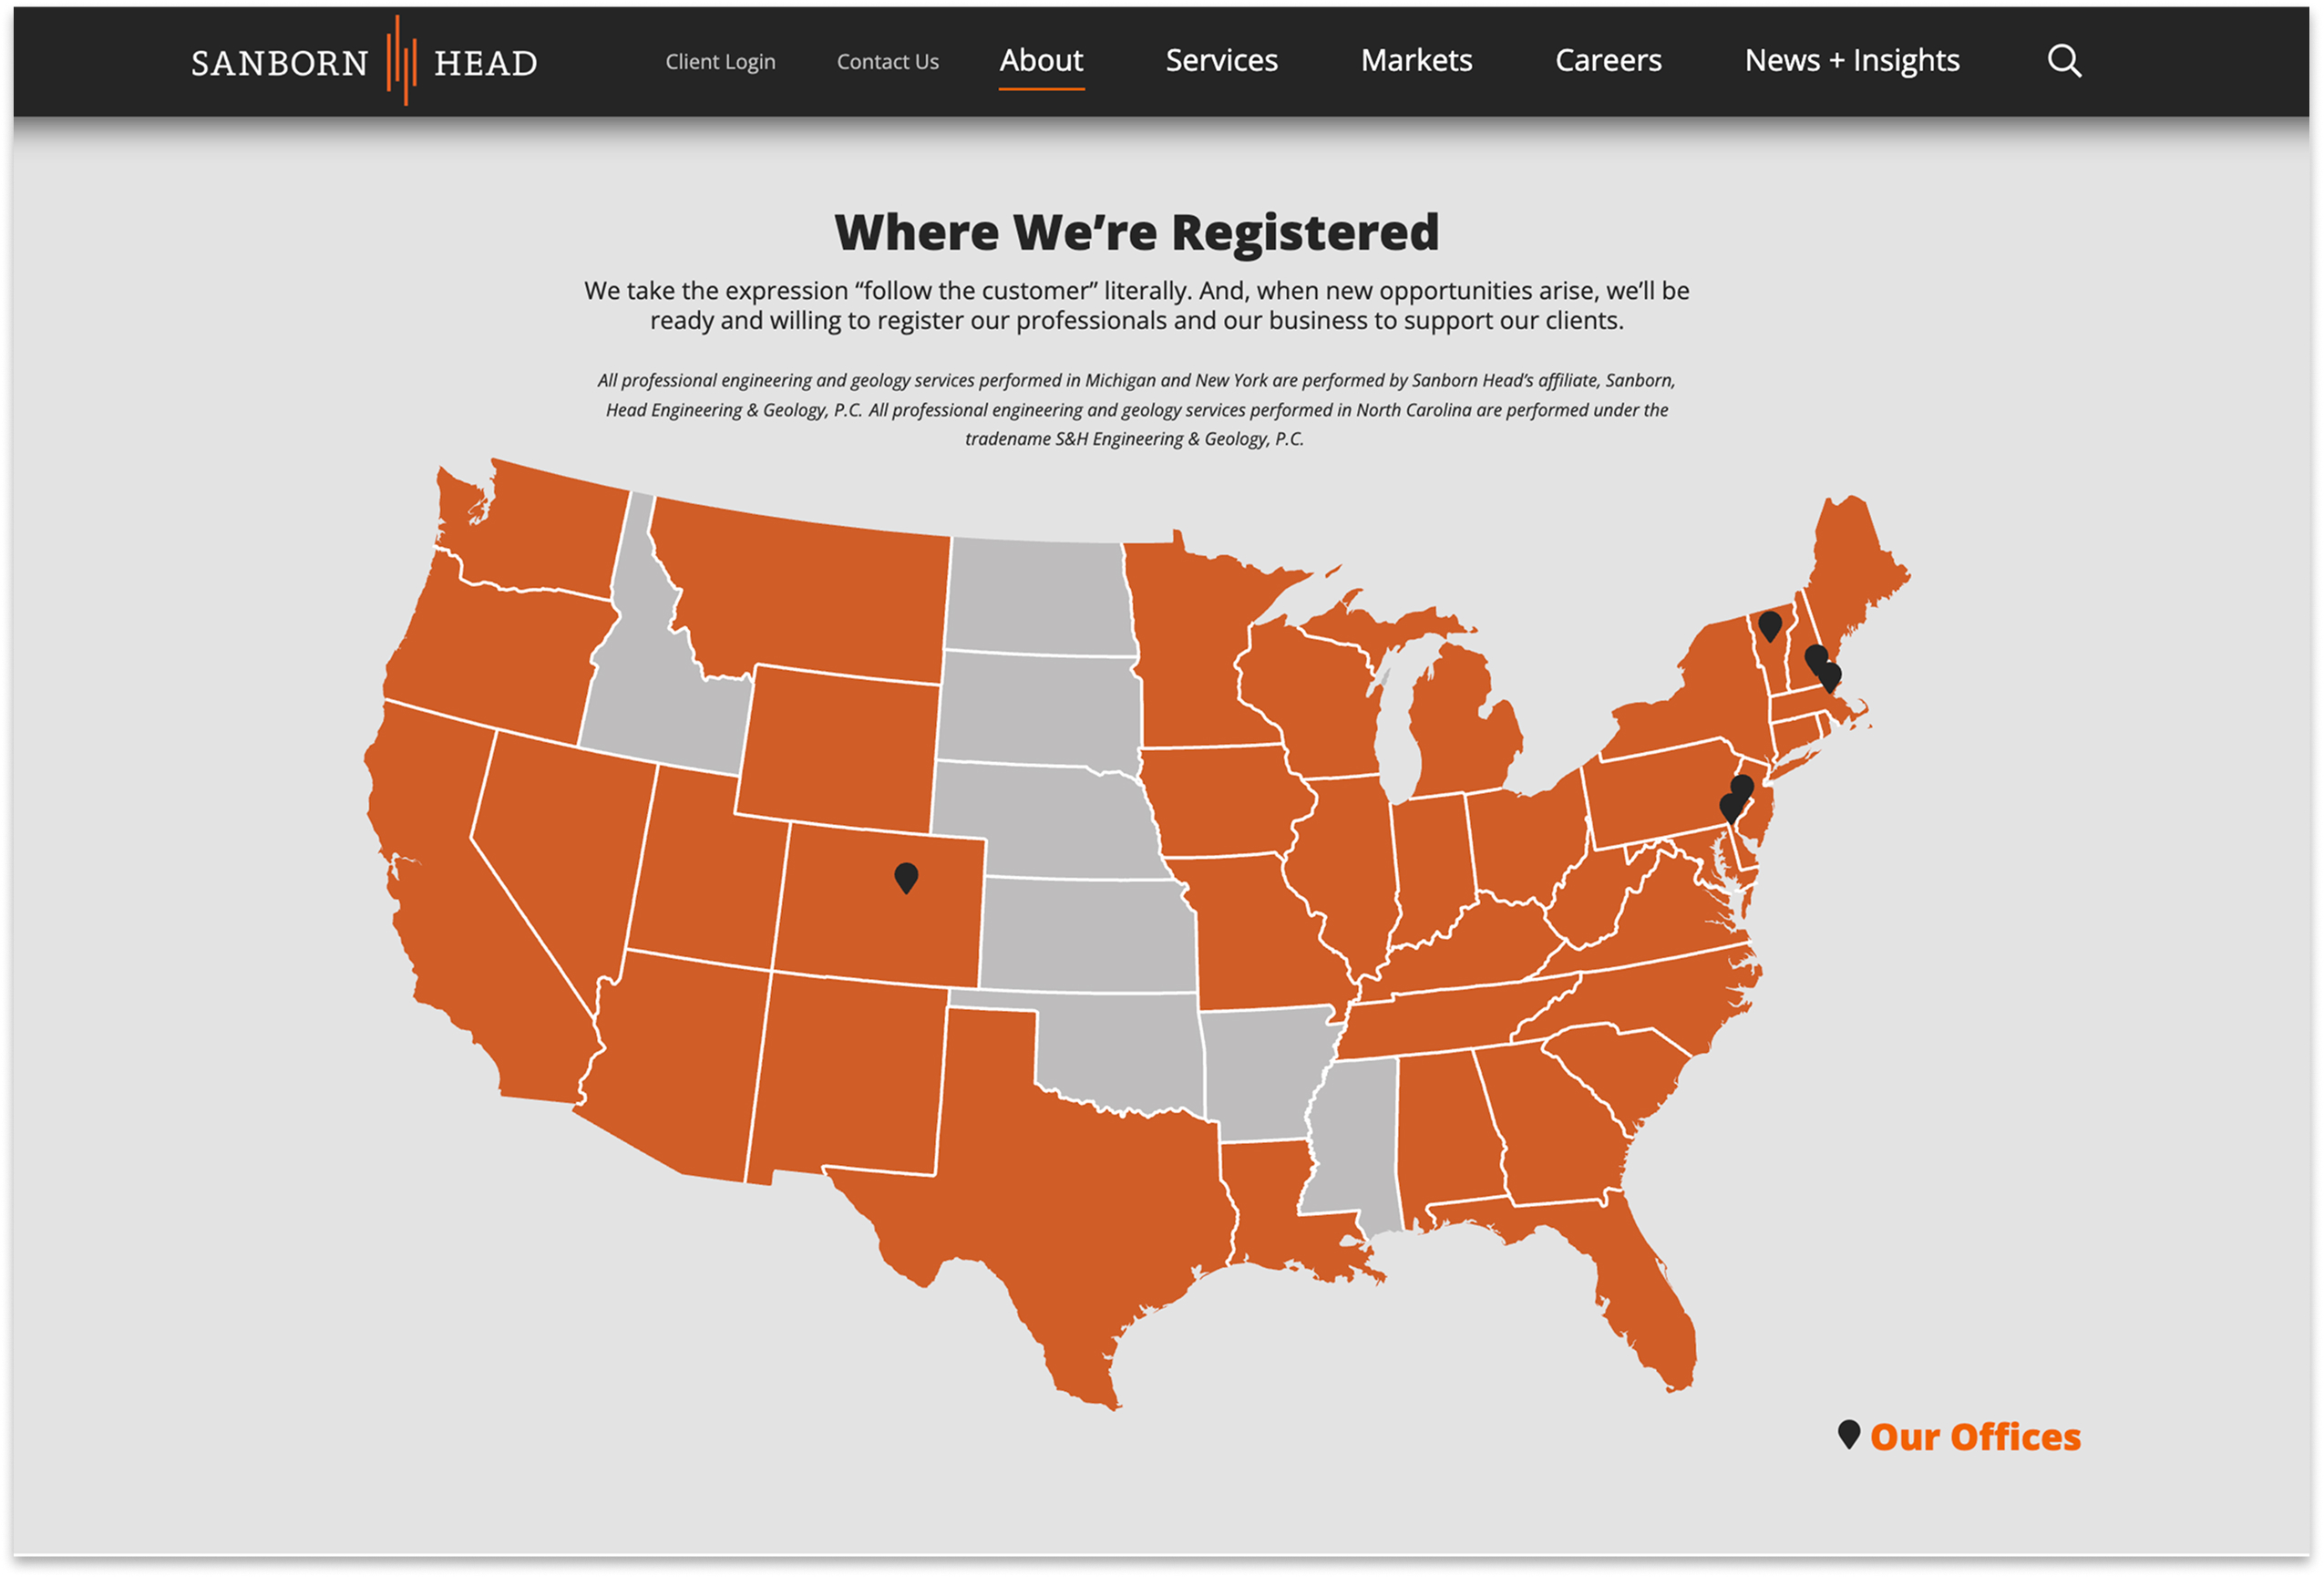
Interactive Infographics
Interactive elements, like hover states, animations, or clickable data points, invite users to explore content more deeply.
Where Can Infographics Be Used On a Website?
When designing infographics, it’s important to think about where they will live on your website. Data can be a powerful asset to converting visitors into clients. How prominent should your infographics be? Where would you like them to drive website traffic? Answering these questions up front can help make your infographics more useful. Stats on professional service firm websites are typically used in two ways.
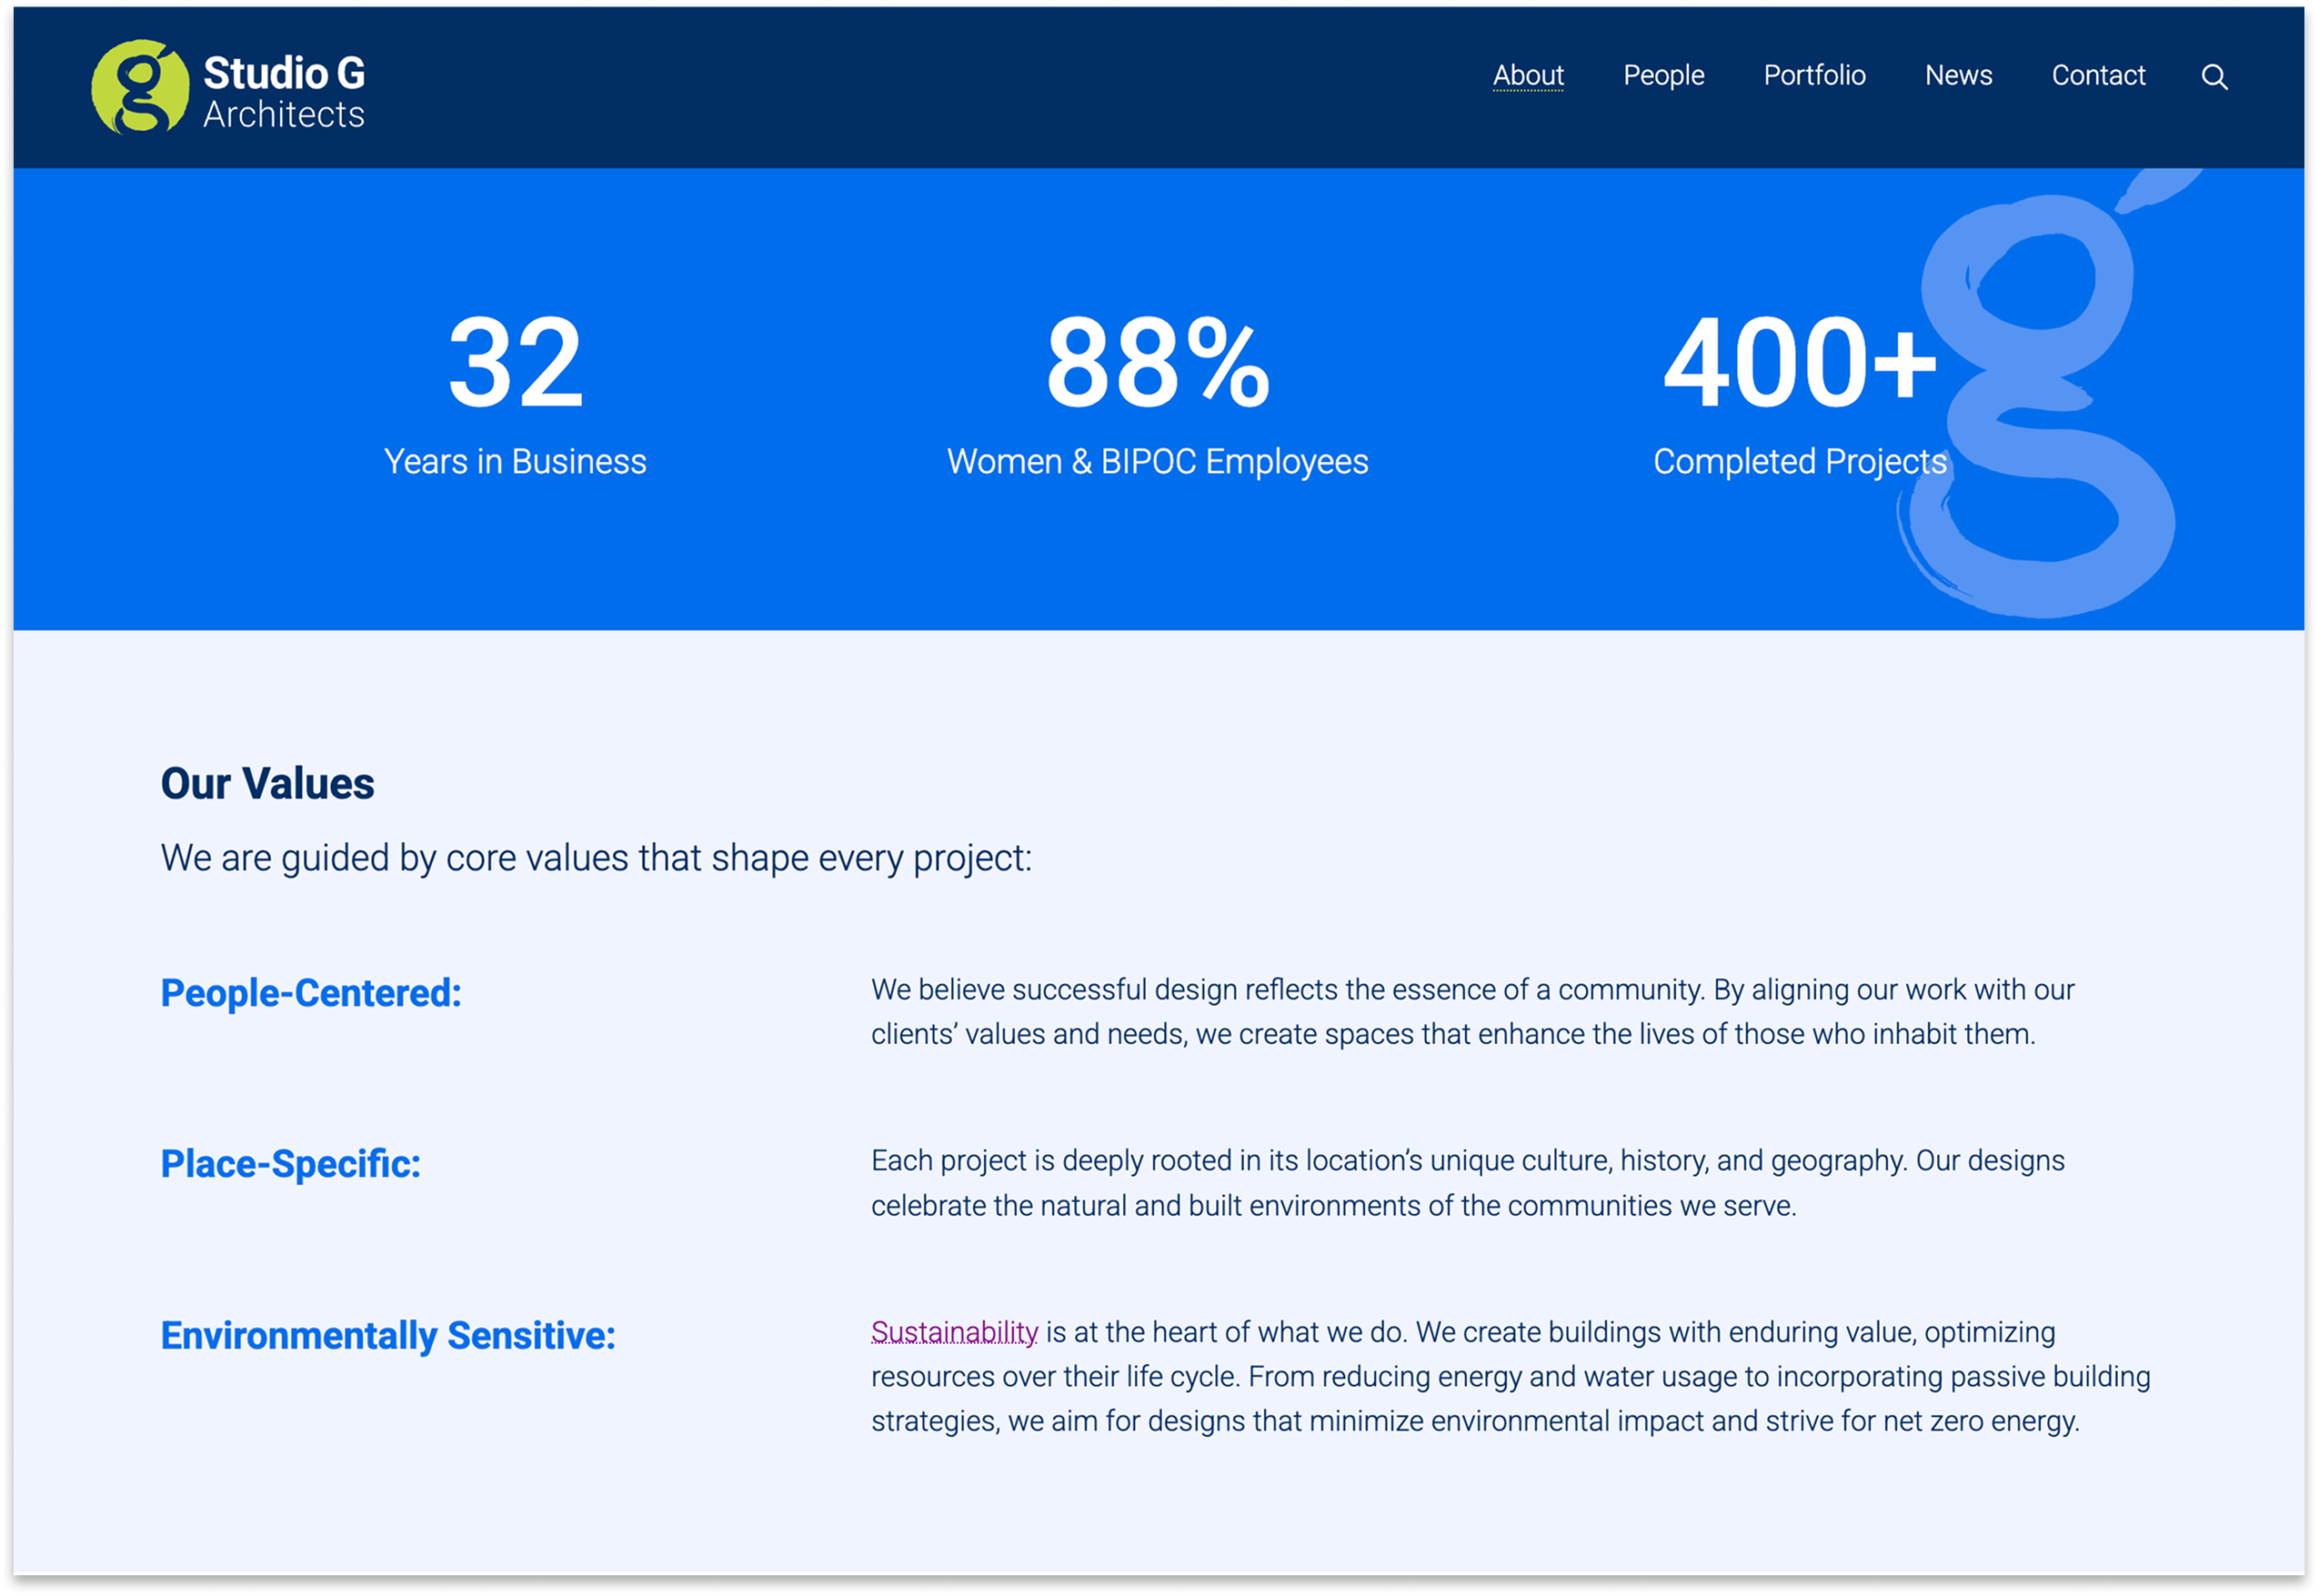
Firm-Wide Stats
Firm-wide stats are often used on the homepage, the about page, and other top-level pages to quickly convey key strengths, scale, or impact.
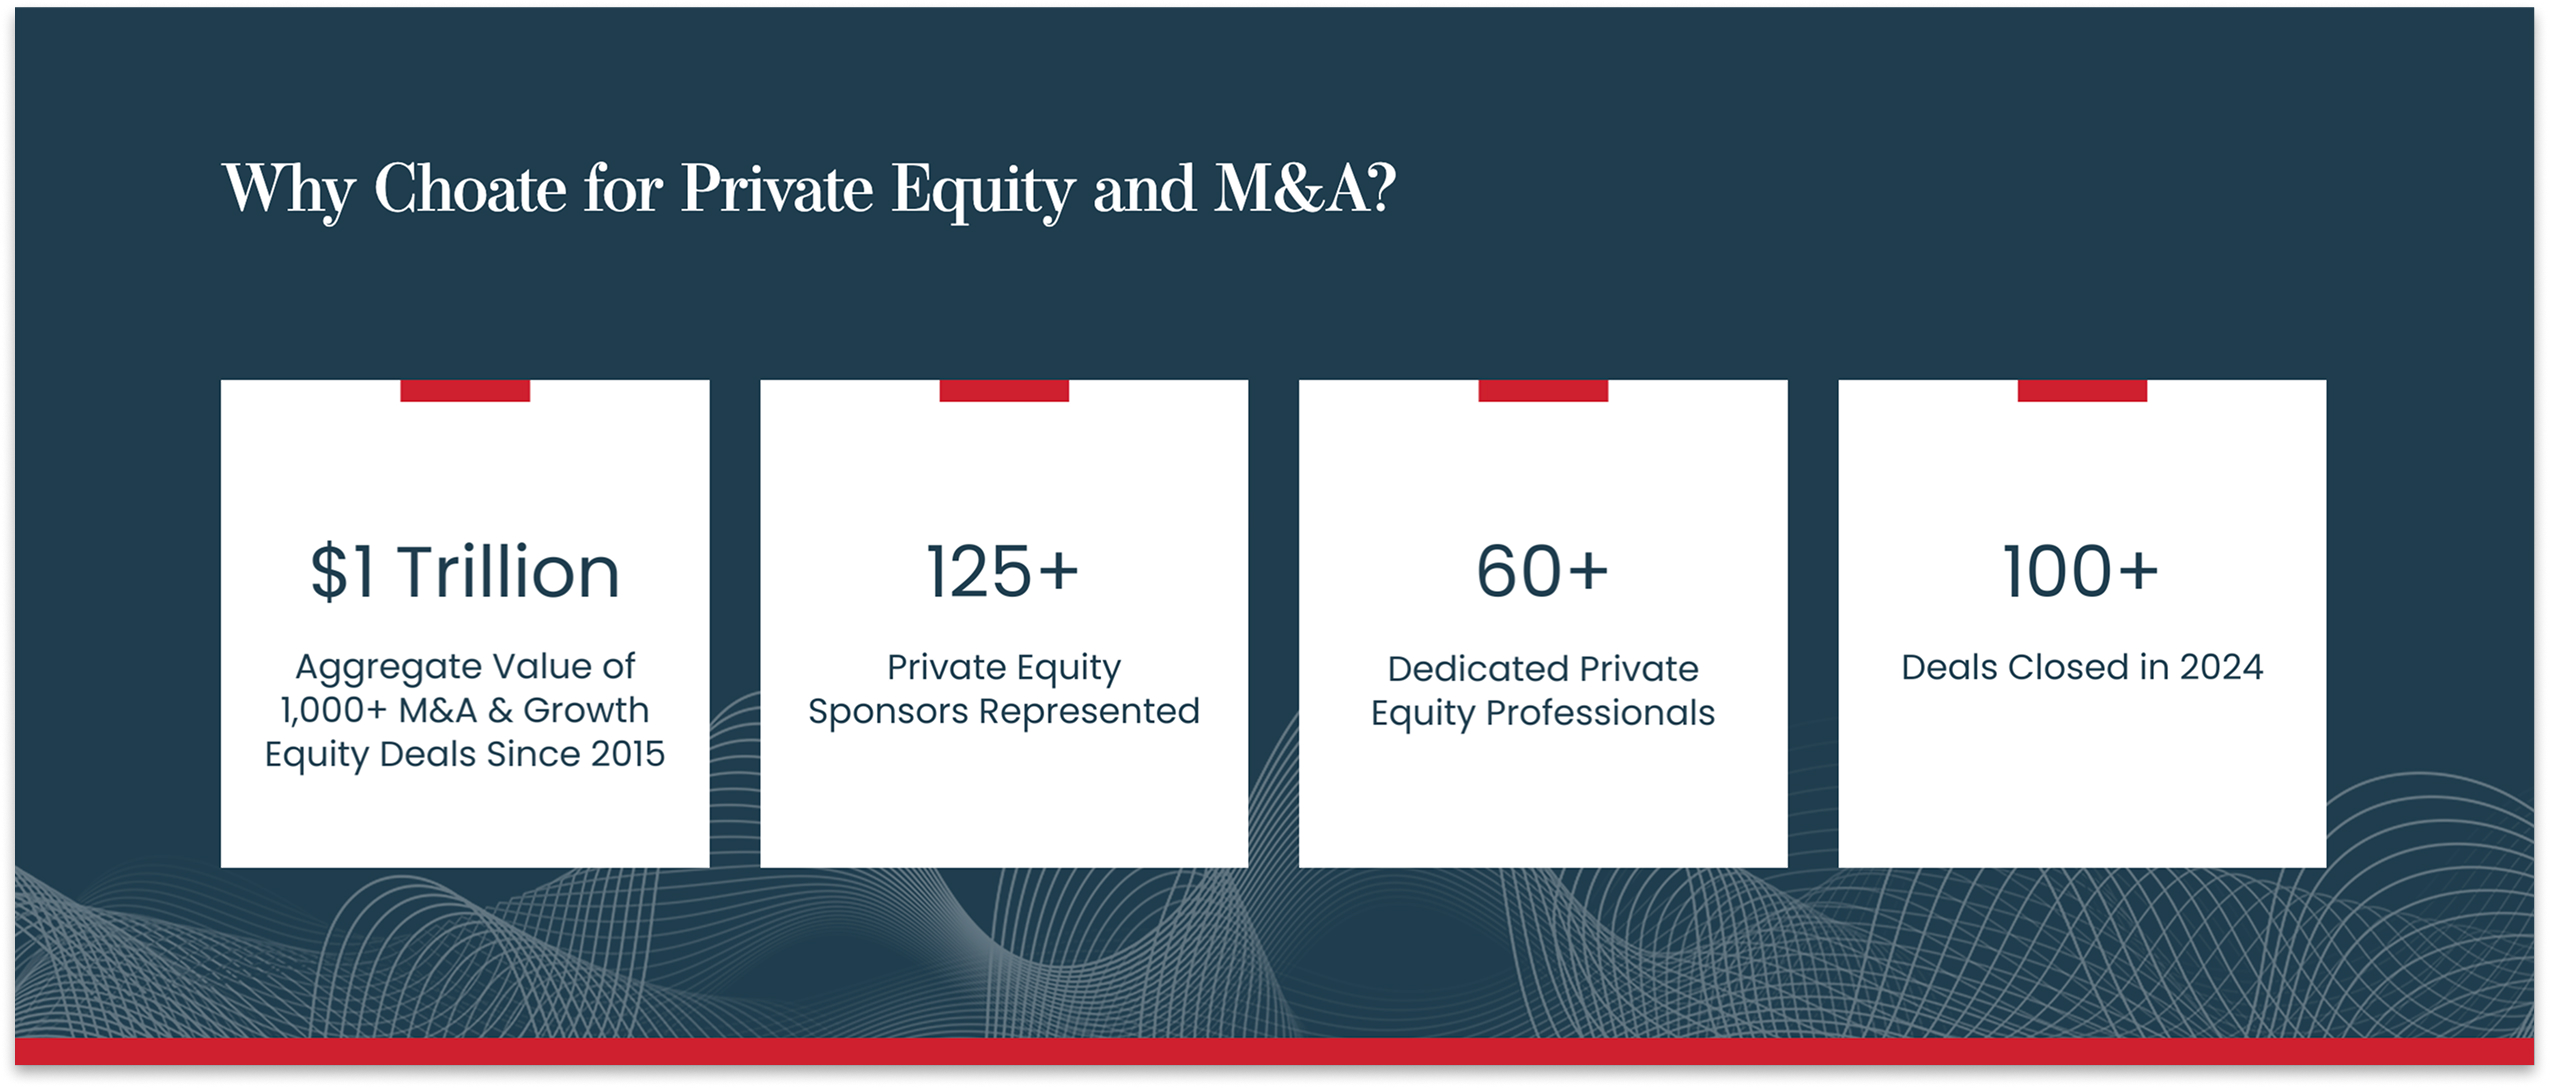
Page-Specific Stats
Infographics can also serve as proof points on more specific interior pages, such as services, projects, and bios.
Infographic Ideas for Your Firm
Homepages, About, Project, Career pages, and more offer strong opportunities to communicate your firm’s strengths at a glance. Highlighting important information such as areas of expertise, awards, and project-specific data in a clear, easy-to-digest format helps showcase your value and can build confidence with potential clients.


Small Visuals, Big Impact
In a world of short attention spans, infographics are your firm’s best friend. They bridge the gap between complex data and quick comprehension, ensuring your most important strengths are seen and remembered. Whether you choose static simplicity or interactive depth, the goal remains the same: make your data work for you.
Ready to Elevate Your Firm’s Data?
If you have questions or need help, feel free to shoot us an email. We love designing effective infographics!
About The Author