Design Lessons & Trends
After more than three decades in the biz, we have plenty of tips and insights to share on design, branding, tech tools, and marketing professional services. Dig in.
Design Lessons & Trends

Project Spotlight

Marketing & Branding Advice

Technical Tips
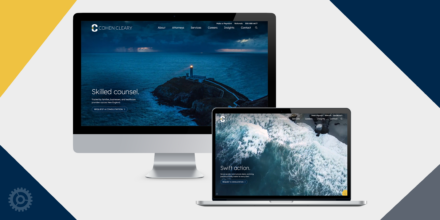
Project Spotlight

Clockwork News

Technical Tips